2025 Coupon and Promo Code Use Statistics
We surveyed 15,000 shoppers in 30 countries. Seasonal sales, local tactics, and cross-border shopping are changing how people save money online.
April 5, 2025
Our study of global online coupon use shows that people save money in different ways. In the United States, online coupon use rose 13.7% in 2024. Most redemptions came through phones and mobile apps, with clear spikes during seasonal events like Black Friday.
Brazil stands out among emerging markets. Food delivery and fashion lead coupon use, helped by influencer tie-ins and flash sales.
These regional patterns are reshaping how people shop and save online around the world.
Coupon & Promo Code Research Overview
We tracked coupon use across 30 countries from January 2023 through November 2024. Sources:
1.2 billion anonymized coupon redemptions from 50+ e-commerce platforms (Amazon, AliExpress, Flipkart, and others).
Survey of 15,000 online shoppers stratified by age, income, and shopping frequency.
Industry data from firms such as eMarketer and Statista.
We tagged each record by device (mobile, desktop), industry (retail, food delivery, travel, and more), and user demographics. We grouped markets as mature (for example the United States) and emerging (for example Southeast Asia).
Key numbers at a glance
- United States: 37% of global coupon redemptions in 2024; mobile share 68%.
- U.S. online coupon use grew 13.7% in 2024 vs 2023.
- Black Friday 2024 U.S. coupon activity was 20% higher than Black Friday 2023 and above typical monthly levels.
- Gen Z + Millennial weekly users: 74%.
- Brazil and India coupon use up 30% in 2024.
- Rural India redemption rate 40% higher than urban when offers use local language and local payment options.
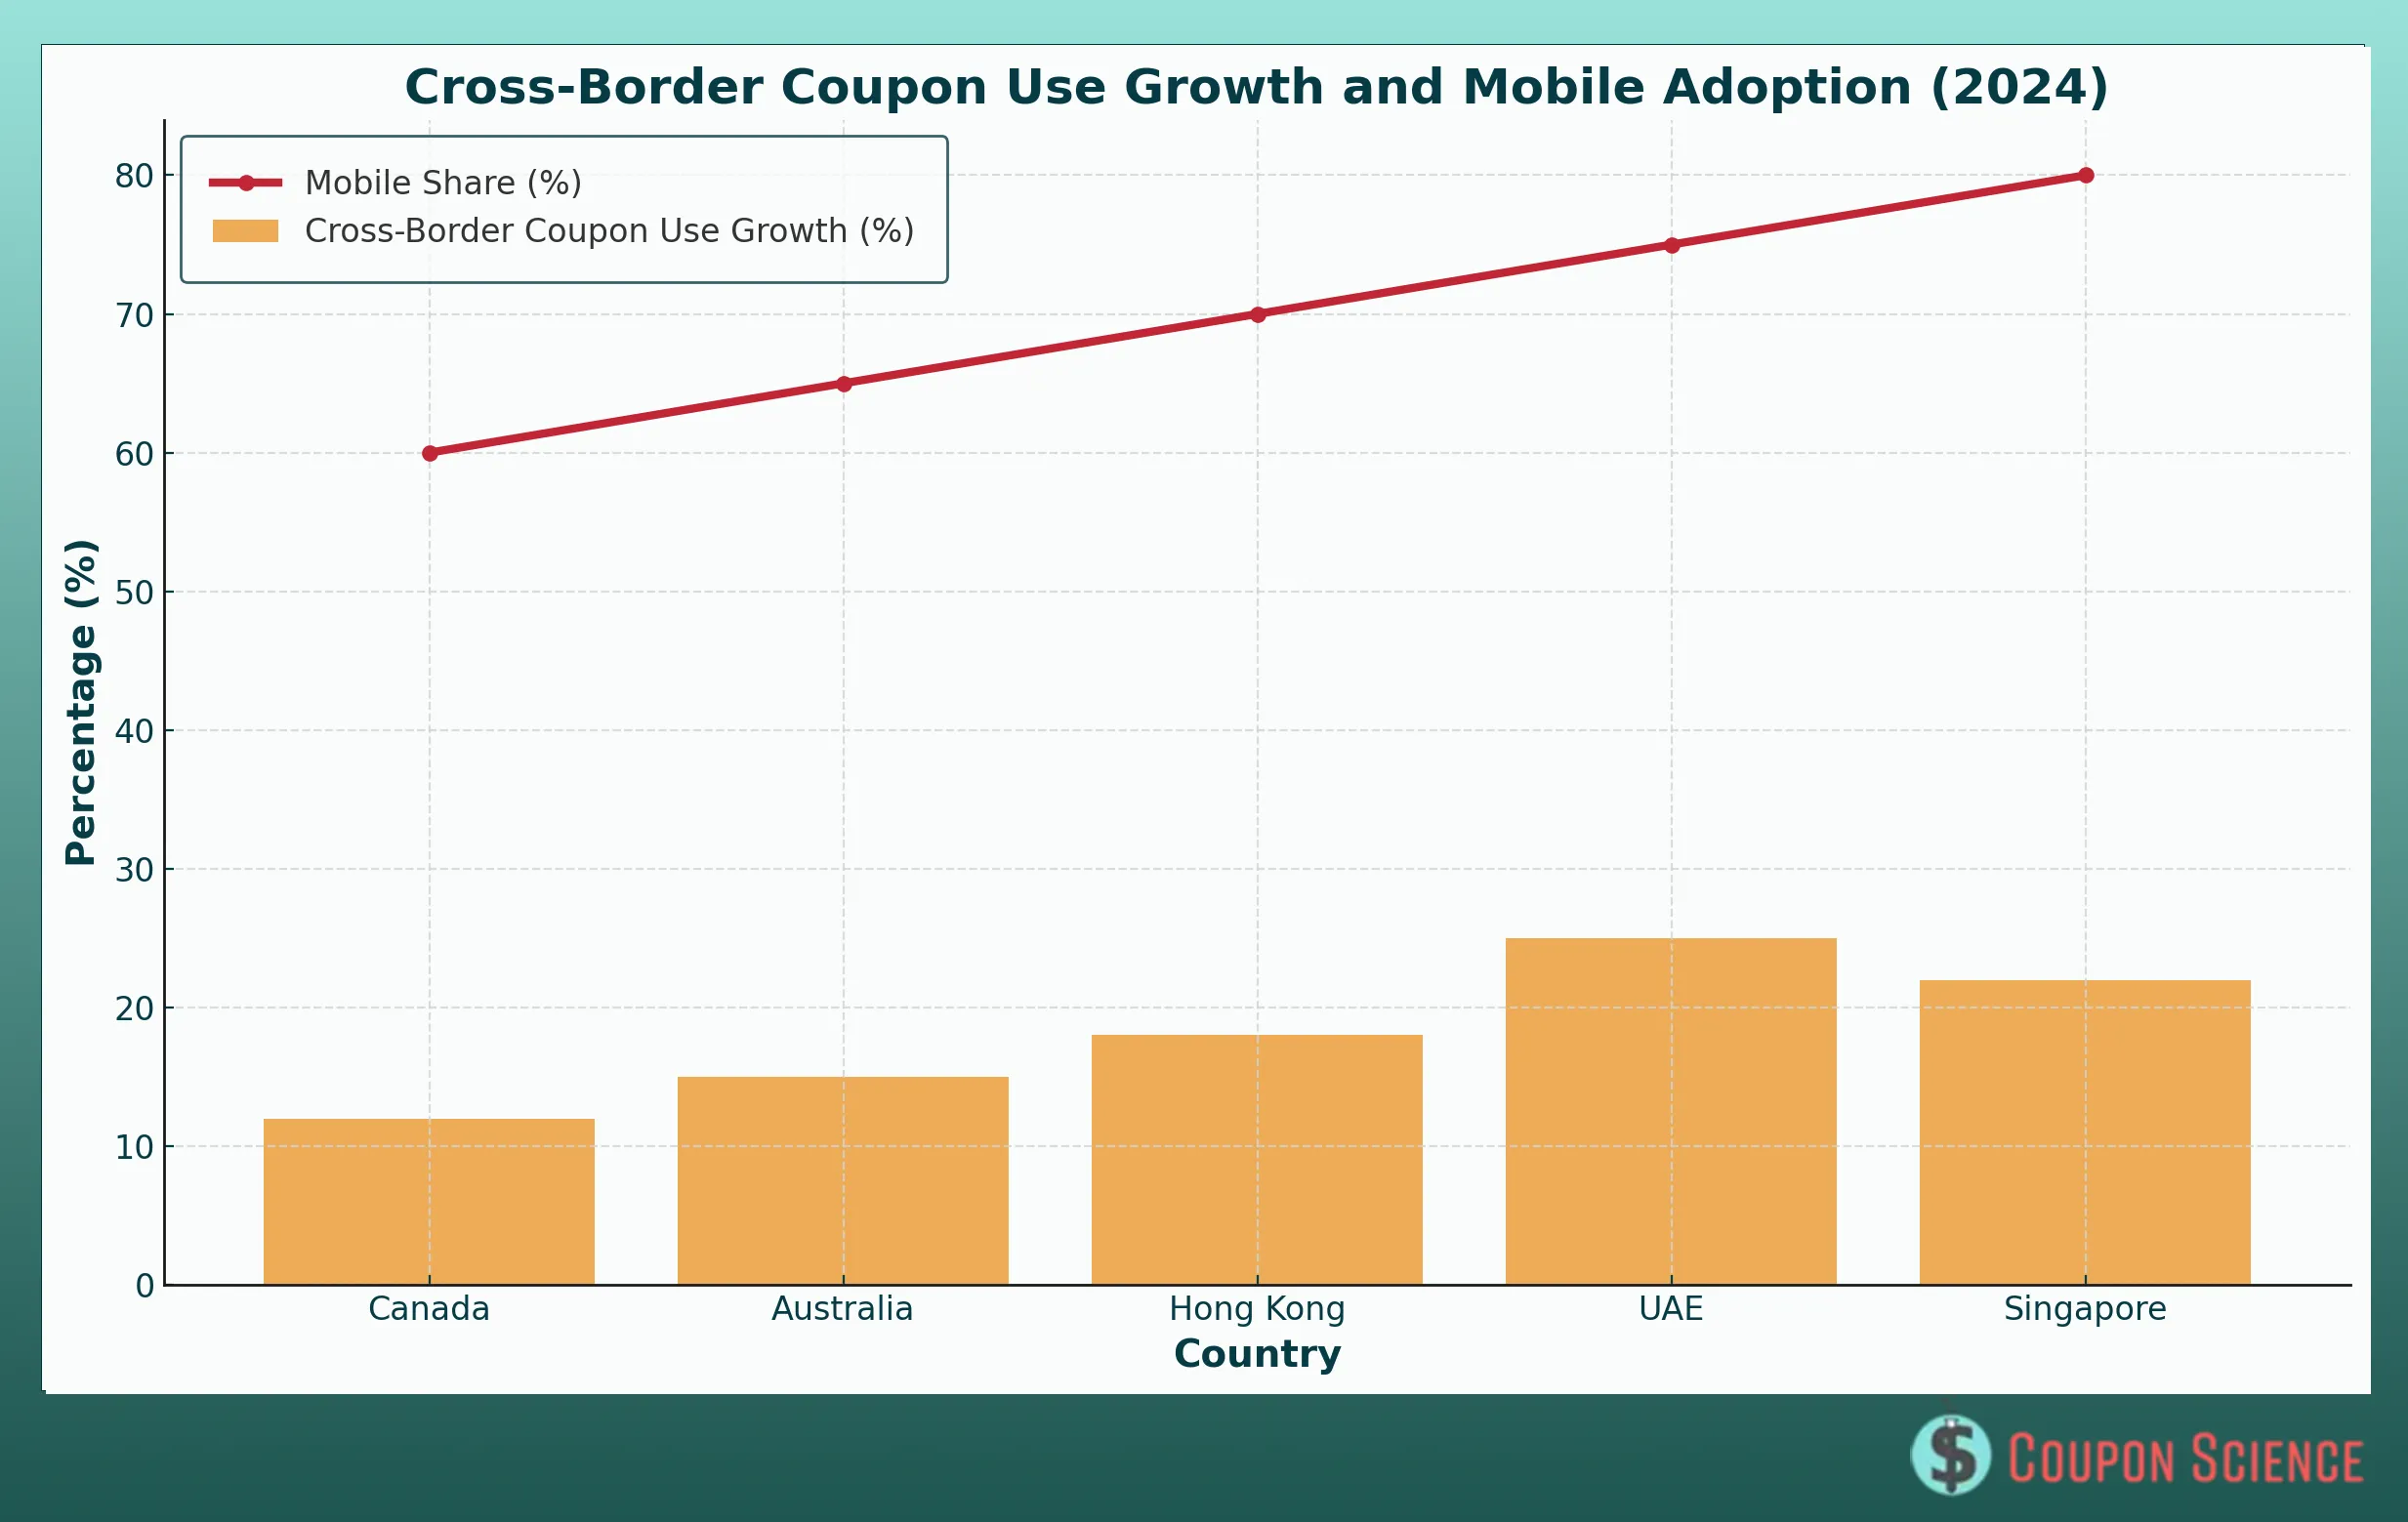
- Cross-border coupon use up 22% in 2024; UAE users reporting international coupon use: 25%.
- Singles Day 2024 coupon redemptions up 40% (fashion, electronics heavy).
- Retail led with 55% of all 2024 redemptions.
- Travel coupon redemptions up 18% globally in 2024.
- Coupon loyalists 45%; deal-seekers 55%.
- During Diwali, 60% of shoppers shifted platforms to capture better offers.
- 73% of users want coupons delivered by app, email, or QR code.
U.S Leads Global Coupon Code Redemptions
The United States is the largest single market, with 37% of 2024 global redemptions. Phones drive the lead: 68% of U.S. coupon use ran through mobile apps and browser extensions that apply codes at checkout (Honey, RetailMeNot, and others).
Online coupon use rose 13.7% year over year. Seasonal peaks matter. Black Friday 2024 lifted redemptions 20% over Black Friday 2023 and pushed volumes above normal monthly levels.

Younger shoppers use coupons more often. 74% of Gen Z and Millennial respondents report weekly coupon activity. Older shoppers redeem less often and focus on needs such as groceries and health products.
Emerging markets: Brazil and India
Brazil and India each posted 30% growth in coupon use in 2024. In Brazil, food delivery and fashion lead. Local influencers and short flash sales keep users engaged. In India, smartphone growth and platforms such as Flipkart and Amazon India drive use, most of all around festival periods like Diwali. Offers in regional languages and trusted local payment flows lifted rural redemption rates 40% above urban results.

Cross-Border Growth
Shoppers in Singapore, the UAE, Hong Kong, and other trade hubs use coupons to buy from international sellers. Cross-border coupon use rose 22% in 2024. In the UAE, one in four surveyed consumers (25%) said they used an international coupon. Price gaps, product selection, and exclusive codes from platforms such as AliExpress and Shein help explain the rise.
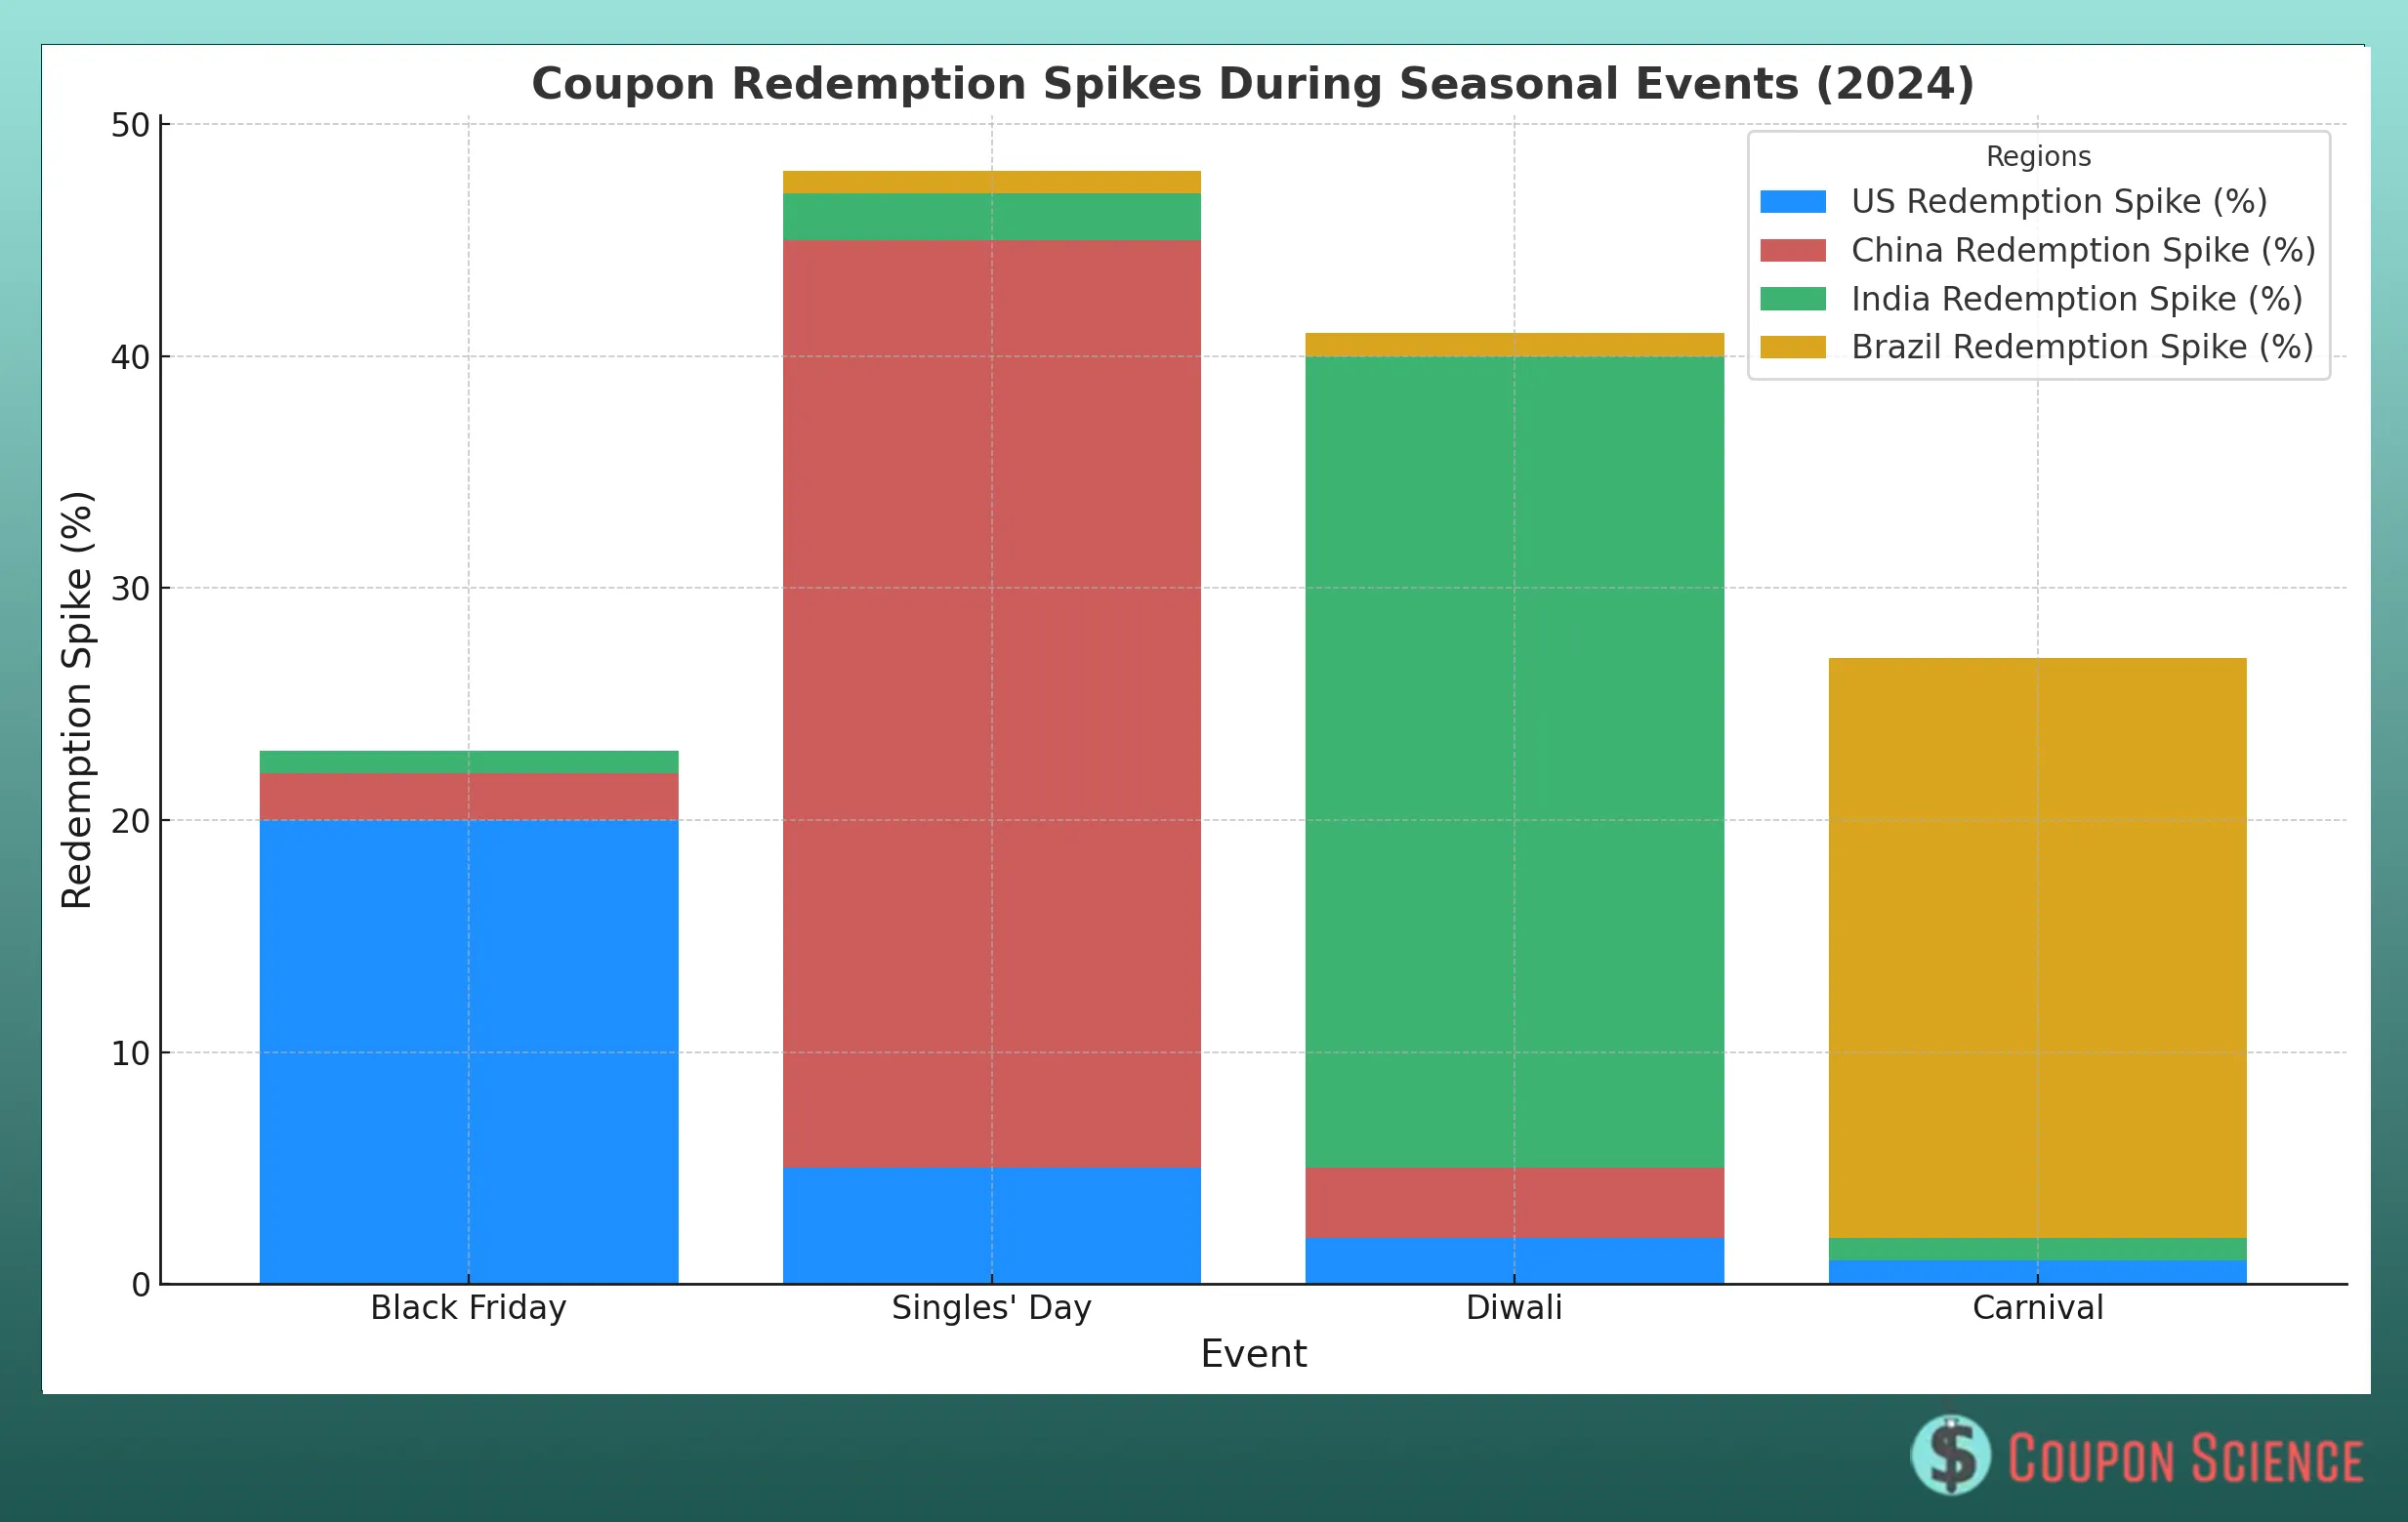
Seasonal events and culture
Holidays and cultural events trigger sharp lifts in coupon use. Examples:
- Singles Day 2024: redemptions up 40% on AliExpress and Taobao; fashion and electronics led.
- Black Friday (U.S.): volumes up 20% year over year.
- Cherry blossom and year-end sale periods in Japan use QR code mobile coupons tied to local retail events.
- Carnival in Brazil drives spikes in food delivery and travel offers in the days before the holiday.
Industries View
Retail accounts for 55% of all 2024 redemptions. Fashion and grocery play big roles and push repeat orders and larger baskets on platforms such as Amazon and Flipkart. Food delivery brands (Uber Eats, DoorDash, Grab, GoFood) rely on coupons to attract price aware diners; some Southeast Asia cuisine festivals saw 30% spikes. Travel is recovering. Airlines and hotels used email and in-app discount codes and saw an 18% global lift in 2024 redemptions. Targeted offers tied to past routes or loyalty IDs improved open and use rates.

User segments: loyalists and deal-seekers
Two main user types show up across markets. Loyalists (45%) hunt for offers from brands they trust and redeem loyalty or member-only coupons. They respond to early access and stackable rewards. Deal-seekers (55%) chase the best discount and move across sites. During Diwali in India, 60% of shoppers moved to alternate e-commerce sites to grab stronger offers. Both groups want ease. 73% of all users prefer digital coupons that arrive in an app, an email link, or a scannable code.
What drives use
Across markets three drivers repeat:
- Timing. Tie offers to known shopping peaks (holidays, paydays, local events).
- Fit. Match language, currency, and payment flow to the user.
- Friction. Cut steps from discovery to apply at checkout. Auto apply works best on mobile.
Looking ahead
The next wave of coupon growth will come from better targeting and simple tech:
- Use purchase and browse data to send offers that match intent.
- Use geotargeted triggers when shoppers enter a store or region.
- Add light game features (spin, streaks, scratch cards) inside mobile apps to draw deal-seekers.
- Link loyalty IDs to push offers that keep loyalists active.
Coupons started as discounts. They now shape channel choice, data collection, and repeat spend. Brands that tune offers to local use patterns can gain share and lower acquisition cost.
Methodology
Timeframe: January 2023 to November 2024. Data: 1.2 billion coupon redemptions; 50+ e-commerce platforms (sample includes Amazon, AliExpress, Flipkart); 30 countries. Survey: 15,000 online shoppers; age, income, and shopping frequency quotas. Methods: time series trend checks; ANOVA to test regional differences; logistic regression to model device use; qualitative coding of open survey text and industry reports. Data hygiene: merged survey and transaction sources; removed outliers more than 3 standard deviations from the mean; ran sensitivity checks for seasonal and cultural events. Limits: self-report bias in survey; undercount of rural markets in some regions; platform coverage heavier in large markets.
Author: Stephanie Nelson